
Abstract: Vulnerability to risk of loss is present in any place where people assemble. The perspective of leadership on existing threats and their response to emerging vulnerabilities directly relates to the probability of exploitation. This article discusses a method that leaders can use to minimize vulnerabilities in their places of worship. Vulnerability governance can reduce risk loss through the use of measurable controls. A predictive posture, through the use of environmental scanning and a mitigation method, helps leaders understand emerging and residual risks in places of worship.
Keywords: place of worship, risk register, vulnerability governance, threat posture, residual risk, environmental scanning, threat horizon
Introduction
Places of worship (POW) are no longer immune to the violent trends that occur outside of their property lines. In fact, POWs, as compared to other organizations, have become a target for violence and burglary worldwide. Two prominent researchers on this topic, Dallas Drake, a criminologist at the center for homicide Research in Minneapolis, Minnesota, and Carl Chinn, a church-security consultant based in Colorado Springs, Colorado, have compiled data over the last several years that reflect troubling trends. The data suggests that there are certainly risks where people gather; places of worship are regular targets of violence. For example, Dallas Drake counts 137 church shootings from 2006-2016 (Drake, 2018), while Carl Chinn (2018) looks more broadly at all violence at all houses of worship, and has tallied more than 250 incidents each in the U.S. in 2015 and 2016. Chinn indicates that 2017 was the worst year for violent deaths in faith-based organizations in the U.S. according to Chinn, in 2017 there were 118 violent deaths, including homicides, suicides, and those killed in action (Chinn, 2018). This data is drawn from the National Church Shooting Database (1980-2005), which is available from ICPSR (Inter-University Consortium on Political and Social Research) in Ann Arbor, Michigan. The public version of the site (which uses the same date range) indicates that there were 139 cases (Bixby, Kielmeyer, & Drake, 2010), whereas most statistics released from the Center for Homicide Research released directly to media outlets only contained 137 cases (Drake, 2018). Regardless, news outlets seem to reflect the sentiment that church-related violence is on the rise (Branson-Potts, 2018; Diep, 2017; Lewis, 2017; MacLellan, 2017; Schenck, 2017).
Where is the balance between faith and action? With this question in mind, the biblical story of Nehemiah should be considered. In the case of Nehemiah, the balance between faith and action is clear. Both were in play as he protected the people by assessing risks and mitigating them through policy and tools, all while accomplishing the work given to him by God. Similarly, places of worship (POW) have the unique challenge of providing an inviting environment to attract parishioners while not being perceived as a soft target for “bad actors.” According to Merriam-Webster, bad actors are troublemakers who may perform bad acts (2018), which can induce a variety of harmful and damaging effects. There are legal definitions of bad acts depending on the context. In this context, the National Church Shooting Database includes bad acts of violence. These potential troublemakers pose a challenge for leadership and security teams.
Many POWs have ignored the increased threat of risk-related loss. The “threatscape,” or risk horizon (Mejias, 2012), clearly indicates that many POWs are soft targets (Hesterman, 2014). This is because many of the risks that exist are tolerated, ignored, or not known. Consequently, vulnerabilities are not mitigated or managed before they are exploited. Now that POWs are at least as vulnerable to internal and external violence as other organizations, a new leadership perspective needs to be taken so that POWs can improve their vulnerability posture. A growing number of mega-churches (1310 with >2000 attendees in 2005) in the U.S. (Warf & Winsberg, 2010) have been improving their security posture by assembling into communities of practice, such as the Gatekeepers alliance (Crockett, 2006). Even so, many POWs have an attitude of risk avoidance as indicated by an industry expert, Scott Stewart (2017); Stewart is VP of tactical analysis and is responsible for Stratfor’s analysis of terrorism and security issues. Says Stewart:
There are no functional equivalents to the SCN (Secure Community Network) or the LDS (the Church of Jesus Christ of Latter-day Saints) security department in the larger Catholic, evangelical Protestant and mainline Protestant communities, though there are some organizations such as the recently established Christian Security Network that have been attempting to fill the void. Following an incident, awareness of the threat seems to rise for a time, and some houses of worship will put some security measures in place, but for the most part such incidents are seen as events that take place elsewhere, and the security measures are abandoned after a short time. (Stewart, 2017)
Given that the environmental system at a POW may be too complex and interdependent to be analyzed as a whole, it must be disaggregated and assessed in terms of its individual components for better understanding (Boyd & Faulk, 1996; Sawyerr, 1993). In addition, consideration should be given to the possibility that domains that make up environmental scanning (ES) methods may change or drift during a transformation or evolutionary step (Choo, 1999; Daft & Weick, 1984; Hambrick, 1982). Consequently, to accommodate environmental, physical, and evolutionary changes, structured methods, or frameworks, for assessment and mitigation should be agile. It is clear that an accurate awareness of a situation through an evaluative framework is critical to task selection and prioritization (Hambrick, 1982), helping leaders navigate obstacles and measure impact (Bossidy & Charan, 2002; De Pree, 2004). Conversely, even though some objective environmental attributes may differ (Bourgeois, 1985; Snow, 1976; Starbuck, 1976), narrow, parochial, or superficial views are not adequate to handle the complexity of scanning (Dess & Beard, 1984; Slaughter, 1999). At the core of vulnerability in POWs is the leadership posture of the organization.
ES is a system-based approach that allows information about an organization’s environment to be collected and leveraged for strategic purposes (Albright, 2004; Choo, 1999; McEwen, 2008; Yasai-Ardekani & Nystrom, 1996). Effective tools must apply to the existing environment, as well as an evolving or anticipated environment. Future scanning (FS) uses early warnings that help leaders develop a planning horizon around threats that may occur or occur more frequently in the future (Aguilar, 1967). Dependencies between environments are often not understood (Slaughter, 1999), resulting in a lack of real progress along a strategic roadmap (Brackertz & Kenley, 2002). The roadmap can future-proof the activity of vulnerability mitigation and strengthen organizational continuity. On the other hand, perceived but ineffectual progress driven by the illusion of risk mitigating action may result in a zero net gain.
Houses of worship are rarely the focus of federal security or crime prevention efforts (Crockett, 2006). The open environment in POWs can be inviting to street criminals, hate groups, terrorists, white-collar criminals, common criminals, and others. A report published by the Christian Security Network indicates that there are 23,000 church crimes per year, of which 1600 are violent crimes based on FBI data (Chadwick, 2018). More current data is difficult to find, as the sources of many loss-oriented incidents and domestic violence are not reported (Baird, 2018; Shellnutt, 2017). However, a safe assumption is that the amount of crime and loss has increased since the study. Proactive preparedness will help faith leaders “protect the flock” while preserving the resources they use to gather together.
Even Nehemiah, while building the wall in Jerusalem, took significant precautions against known and unknown threats (Neh. 4). Basic behavioral or event detection techniques may help identify a potential violent episode before it happens, or provide an opportunity to prevent threat escalation. Unfortunately, violence often takes worshippers by surprise (Romain, 2017). Even if armed guards are present, do they know what is happening, where it happened, and when it happened? Even low-frequency events, such as lone wolf attacks, can cause significant losses to occur. A reliance on heroics by those nearby is not the best strategy. Even though high loss events are infrequent, these threats should be known and captured on a risk register (Patterson & Neailey, 2002; Baker, Anderson, Bishop, MacLeod, Parkinson, & Tuffen, 2014). A risk register should identify which threats have been mitigated/minimized, list which threats remain, and be periodically updated. The risk register contents should be known by leadership; they agree to live with the vulnerability that will exist absent any mitigating action. They will also enact mitigations based on priorities and resources.
The amount of time between scanning activities tends to increase with environmental uncertainty; however, scanning frequency decreases when uncertainty is overwhelming, when absorptive capacity is exceeded (Choudhury & Sampler, 1997; Cohen & Levinthal, 1990), or when useful information is not accessible (Hough & White, 2004; Mejias, 2012). Why? Because otherwise, these scanning activities do not produce meaningful results. Concurrently, a perception of diminishing returns from scanning efforts in a stable environment may lull an organization into catatonic complacency (Hough & White, 2004) or entropy (D’aveni, Dagnino, & Smith, 2010; De Pree, 2004), all while risk threats accumulate unnoticed.
Informal, or ad hoc, scanning by leadership teams is typically short term, infrequent, fragmented, and may be initiated by a crisis (Aguilar, 1967; Hambrick, 1979; Hambrick, 1981; Kefalas & Schoderbek, 1973). Even though leaders typically conduct scanning more frequently (Hambrick, 1981), strategy making may be linked to subjective interpretations in difficult to comprehend and rapidly changing environments (Elenkov, 1997; Jogarantnam & Wong, 2009; Hambrick, 1981). A proactive stance may be further inhibited when POW leaders assume that security team leaders are performing scanning when, in fact, they are not (Hambrick, 1981).
Scanning accuracy is dependent on the threat domains selected and the approach taken (Hrebiniak & Joyce, 1985). For example, a kitchen worker might abide by clear-cut behaviors, while youth leaders without clear role definitions or explicit bounds might have a more ambiguous linkage to threat domains (Hambrick, 1981). Perception accuracy is a basis for managerial action (Tsai, MacMillan, & Low, 1991), and scanning is the first step in the development of perceptions (Carpenter & Frederickson, 2001; Davis & Meyer, 1998). Consequently, vulnerability assessment voids are particularly risky (Hambrick, 1981), jeopardizing needed control implementation. It is clear that continuous scanning must include structured data collection, using optimized frameworks that clarify perceptions, tasks, and reveal actual results from actions taken (Bourgeois, 1985).
Two general measures of scanning strategy are frequency and scope (Beal, 2000; Yasai-Ardekani & Nystrom, 1996). The range of characteristics of an expected environment helps leaders make decisions today that align them with a desired future, at a suitable pace. In high-risk organizations, scanning frequency, scanning intensity, and scanning type (Jennings & Lumpkin, 1992) matches, or exceeds, the environmental change rate (Choudhury & Sampler, 1997) so that desired future states can be realized in time (Hough & White, 2004; Sawyerr, 1993). A lack of predictability, environmental fluidity, and complexity drive scanning strategies (Czarniawska, 2007; Duncan, 1972; Dutton & Jackson, 1987; Ebrahimi, 2000; Thompson, 1967).
Leaders in complex and risk-laden environments are especially challenged to comprehend threats (Anderson & Tushman, 2001; Fahey & Narayanan, 1986; Goll & Rasheed, 1997; Snyder, 1981). Organizations perceive their environments differently. This perception depends, at least partially, on their strategic approach, and if data is involved (Zahra, 1987). Organizational intelligence influences strategic decision-making. Data completeness and analyzability influences sense-making (Sutcliffe, 1994). Proactively, data structures must assist with processing needed to develop, pursue, and monitor a strategy (Choo, 2001; Jogaratnam & Wong, 2009; Lau, Liao, Wong, & Chiu, 2012). Otherwise, POW leaders may decide that an environment is unanalyzable, avoiding ES at their own peril (Aguilar, 1967; Ferrier, Smith, & Grimm, 1999). Ultimately, making sense of ES activities occurs when leaders construct an assessment strategy by framing experiences and by creating new capabilities (Milliken, 1987). Strategic enactment occurs when activity, often simultaneous, is introduced to accomplish tasks, create new capabilities, and create sense within them. It is clear then that leaders with limited capacity for information processing have to be efficient in their approach (Daft & Parks, 1988) to get a predictive picture of what is to come, hence a need for scanning accuracy.
While this article is focused on POWs, this information can be applied to other locations. Even though many POWs are unique, the tools presented are transferrable and, with minor modifications, could be practically used in many locations. While some leaders in POWs are taking significant measures to protect their flocks, many others believe that the risks they could incur are tolerable. Some of this risk comes from threat sources, while other sources are the risks associated with a lack of compliance with policy. To understand this better, leaders must understand what the threats are, how well they are being mitigated, and have an interest to mitigate the residual risk that exists. The residual risk is the type and magnitude of the threat that has not yet been addressed. This risk continues to be carried by the leadership of the POW and should be known to them.
This article is broken into five sections. The next section discusses the risk register as a method for vulnerability assessment. Next, there is a brief discussion about threatscape management, followed by the idea that many leaders have an illusion of security. In the next section, the author discusses a predictive leadership approach to risk governance. An engaged leader must have mechanisms that enable the discovery of threats before vulnerabilities are exploited. The insight gleaned from the tools presented in this article can be used to create transparency in the environment on an ongoing basis. In the last practical section, a tool is discussed that ultimately will enable the visualization of the threatscape in its current form and then with the augmented controls enacted.
Risk Register: The Vulnerability Assessment
The document that enables dialogue about and lists the vulnerabilities and threats in an organization is called a “risk register” (Patterson & Neailey, 2002; Baker et al., 2014). Action can be taken from the transparency created by the tool. The quantification of risk across the organization allows leadership to apply their appetite for risk in a more accurate and informed way. Minimally, the risk team and leadership should be made aware of its contents periodically. At risk are organizational continuity, loss of property, loss of life, loss of attendance, loss of ongoing revenue, and brand damage. Each section of the risk register for this case will be discussed in detail in this section.
The risk register is essential for threat management, as it records identified risks, their severity, and the actions steps to be taken to reduce threats (Patterson & Neailey, 2002; Baker et al., 2014). It can be a simple document, spreadsheet, or a database system, but the most effective format is a table. A table presents a significant amount of information in a small area. Security leaders should use the risk register as a risk management tool (Patterson & Neailey, 2002; Baker et al., 2014). It should be reviewed and updated continuously so that it can identify, assess, and manage risks to acceptable levels. For leaders to decide what mitigation is acceptable, they need to know the risks that are present and have a clear understanding of their risk appetite. Not all risks are known, and some emerge over time. However, existing threats can be determined based on insight from security team members, past events, and from news accounts both local and national. Even with this information in hand, allowances should be made for surprises. The register provides a framework in which known elements that threaten the activities at POWs are captured.
Setting up the risk register is important for clarity and understanding of the threatscape (Patterson & Neailey, 2002; Baker et al., 2014). Leaders comprehend scanning results when they understand the interaction between identified threats and their influence on the local risk taxonomy (Aguilar, 1967; Hambrick, 1979; Kefalas & Schoderbek, 1973; Venkatraman, 1989). Attributes of variables in ES could include: environmental complexity, rate of change, organization size, impact and frequency of risk events, as well as information source reliability (Jennings & Lumpkin, 1992; Lindsay & Rue, 1980; Robinson, 1982; Valencia, 2010). The need for these variables, their variety, an acceptable variation range within each one, and their weighting validate the need to customize a scanning framework to a specific location.
The literature categorizes variables as controllable (ex. location, parishioner base, task assignment, organizational structure, and capacity) and uncontrollable (ex. parishioner behavior, collaboration between functional areas, technology changes, economic conditions, attendance drivers, and regulatory restrictions) (Mitroff & Emshoff, 1979). Controllable variables can be influenced while uncontrollable variables typically require forced adaptation (Mitroff & Emshoff, 1979). An example of forced adaptation could be the establishment and enforcement of a policy. A vulnerability measuring system needs to accommodate these attributes and accurately represent the threats and associated variables chosen. Of course, data collection planning and analysis methods assure that the data collected is complete, relevant, and timely (Choudhury & Sampler, 1997).
The risk register must be current and transparent to leadership, so they can see which risks or vulnerabilities they are tolerating, and which ones are being addressed (Patterson & Neailey, 2002; Baker et al., 2014). Leaders may flag risks that haven’t been registered so that they are included in the vulnerability measurement and so that leadership can provide options for risk mitigation. There are several key sections to the register. An overview of the figure on the next page, an actual place of worship risk register is discussed.
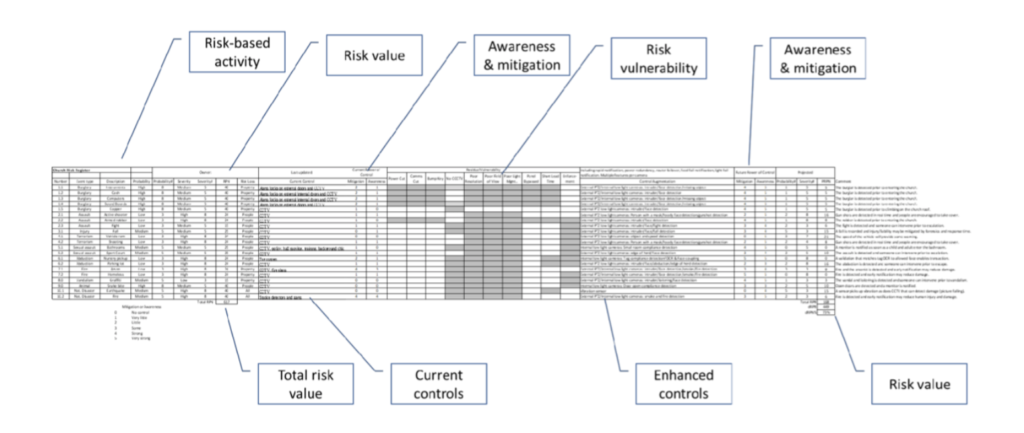
The risk register’s owner is listed at the top on the left, next to the risk register’s POW. This person should be on the security team and is responsible for adding threats as they emerge or are discovered. The landscape is constantly changing, and the risk register needs to be kept up to date so that leadership is aware of the vulnerabilities and actions taken to mitigate them.
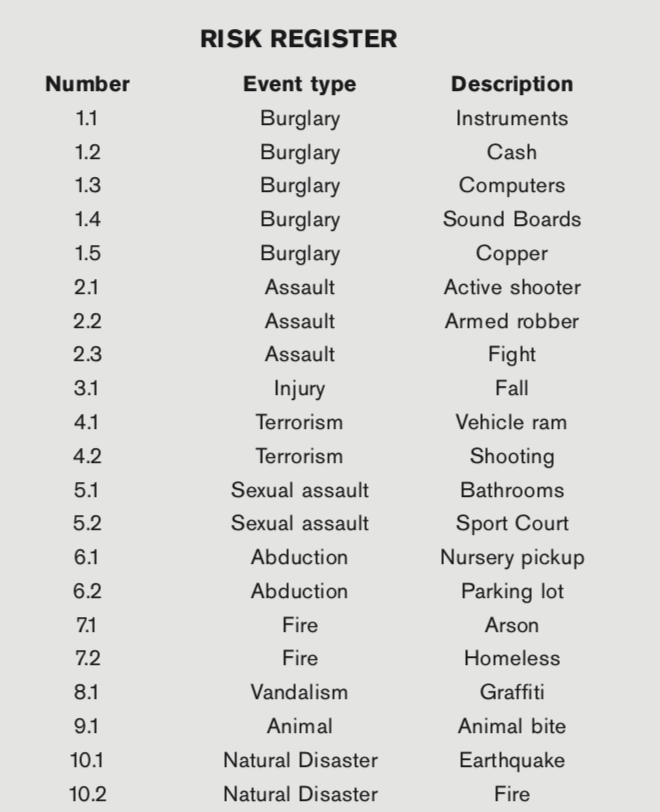
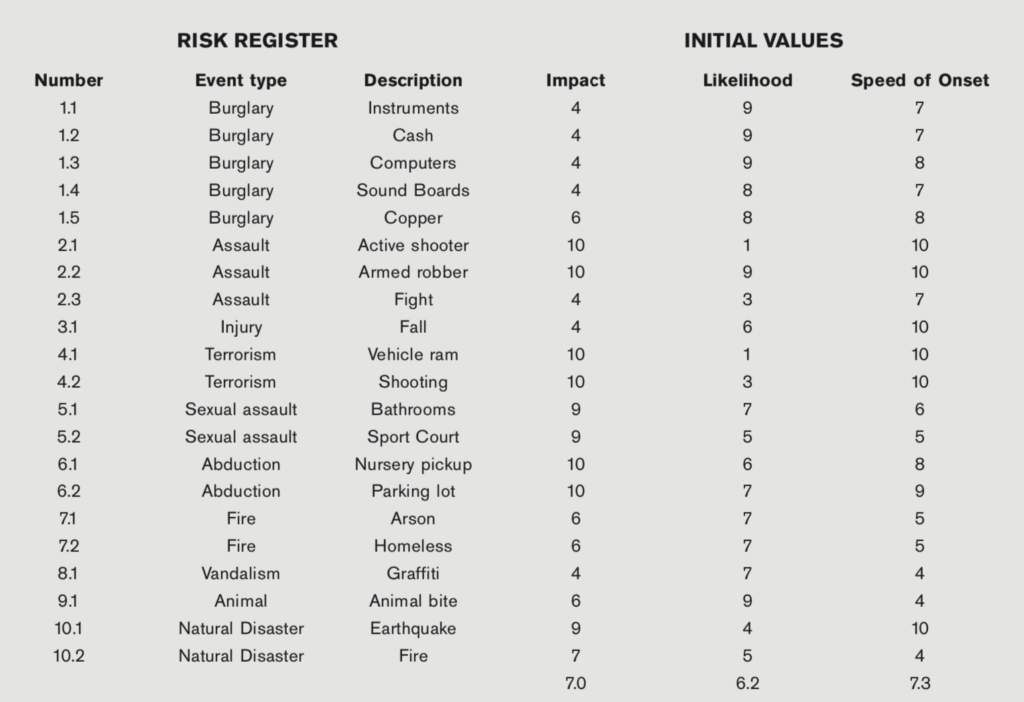
Each threat should be assessed on several levels. First, once registered, the threat can be given an item number for reference. The first digit can be related to the type of threat (ex. “1” for burglary) with the decimal number being the action from the threat source (ex. “1.1” for stealing instruments). This allows for a breakdown of a threat into risk loss categories and is illustrated in the figure below.
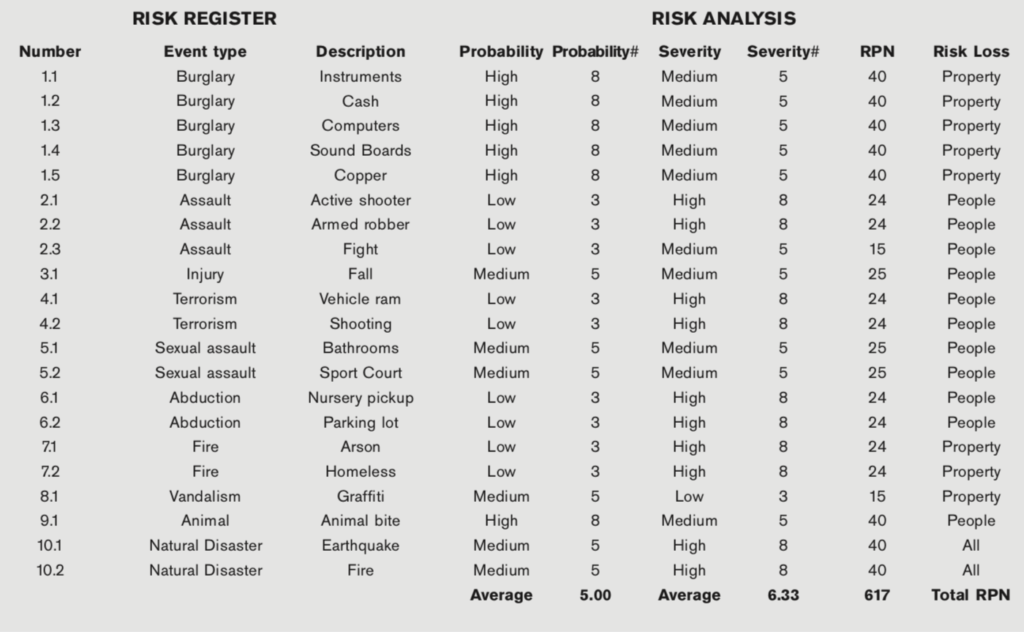
Each threat action can be described in terms of the probability and severity of the occurrence. The probability and severity are simply defined as high, medium, or low. No one knows this better than the security team, as they know the history and impact of losses. The probability and severity numbers are an 8 for high, a 5 for medium, and a 3 for low. These two numbers (probability and severity) multiplied by each other produce the risk priority number (RPN). The spreadsheet can be sorted on this column from highest to lowest to produce a prioritized list of threats. This may help with consensus regarding which risk to work on first. By reducing the highest priority threats first, the RPN is reduced faster. The average probability and severity will be reduced with increased mitigation influence on the risk. In the meantime, these three numbers can be used as a baseline for the current threatscape along with the existing mitigating controls. Typically, when the risk-loss type is human, the severity number will be higher. These elements are shown in the figure below.
In a column to the right of the risk loss type, the existing controls can be listed as shown below. It is good to know how strong the controls are for mitigating the risk. Where the controls are not strong, they should be enhanced to reduce the RPN. Nehemiah didn’t just post a guard. He also had the wall builders keep their arms nearby when they ate and when they worked. He took extra measures to make sure that the work was not threatened or compromised. The actions Nehemiah took were seen by bad actors and became a deterrent. If Nehemiah had not predicted the risk threats, then his actions would not have been eventually taken.
There are four types of leaders as described in this article:
- Predictive–anticipates that threats will emerge.
- Proactive–mitigates threats that are known before loss occurs.
- Reactive–focuses on recovery after a loss has occurred.
- Non-reactive–do not recover from an exploited vulnerability.
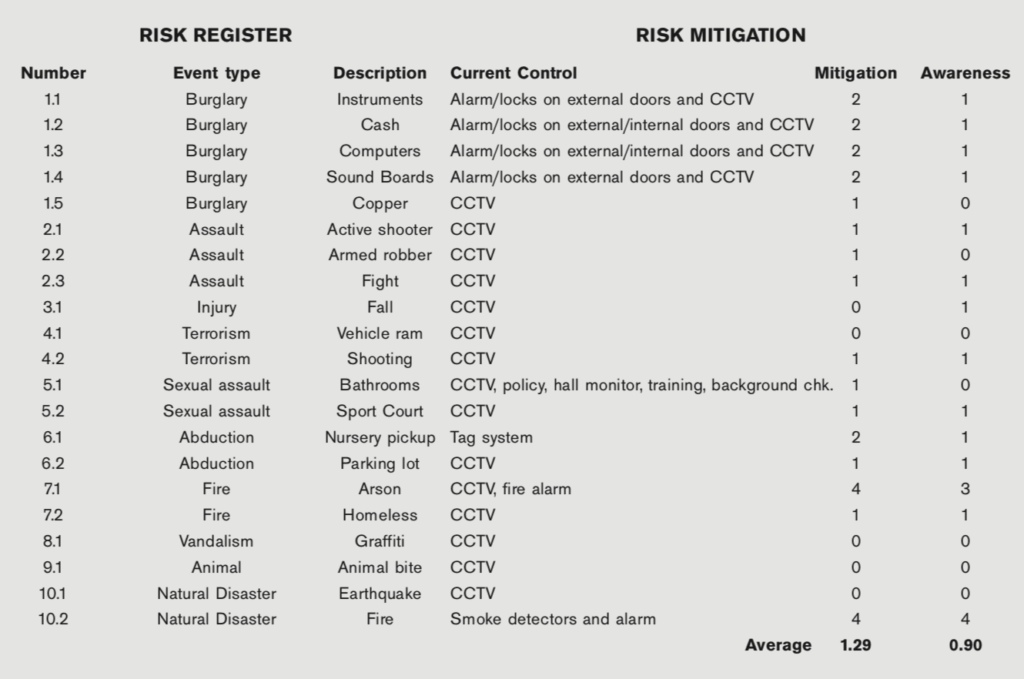
In the table below the existing controls are listed against the threat sources. The power of the controls is represented by two values based on a Likert scale below.
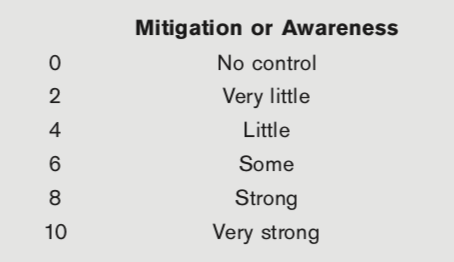
The first, mitigation, is the extent to which the control mitigates the threat. The other, awareness, is the extent to which the control makes those who can take action to mitigate loss aware of the threat so that they can take action. Again, the average values of the mitigation and awareness variables can be seen as a baseline to be improved.
The current threatscape is now documented. The known threats are registered along with their potential impact. The existing mitigating controls and their influence is documented with measures. With this information, the solutions part of the risk register can be exploited to reduce baseline values. Leadership will need to decide if physical or procedural controls will be used. If procedural controls are used, a discussion about enforcing the procedures will be relevant. Additionally, the reaction time to threats must be minimized and methods for the enforcement of policies will need to be considered. The choices made have an effect on the existing vulnerabilities and reduce the risk threat values.
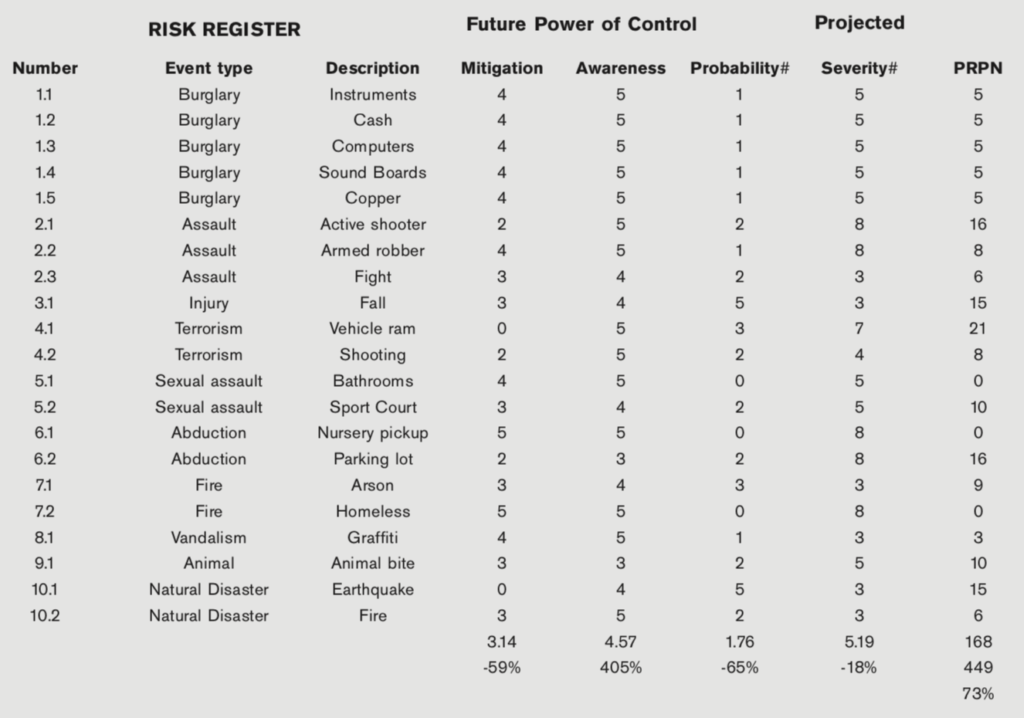
The mitigations taken are unique to each site and so are not listed; however, their impact is listed in the table below. This table indicates that each control was augmented to a varying degree based on a like-for-like assessment in relation to the based control. The net impact is a 73% reduction in the RPN. This reduction is reflected by the difference between the current and the future RPN, or the projected risk priority number (PRPN), and is labeled as the percent reduction between these two numbers. The control augmentations and enhancements (not listed) will need to be assessed for their influence on the threats, resulting in an improvement in awareness of threats, an improvement in mitigation power, a reduction in the probability of occurrence, and a reduction in severity if the vulnerability is exploited. While the percent reduction in risk is not exact, it represents a method that was applied to a case to measure risk threats. Also, it shows considerable impact from the actions that were taken. If the percent reduction were ten percent, then leadership would need to require more analysis so that stronger solutions are brought forward.
Threatscape Management
The contents of the register will indicate if the facility is a hard or soft target (Patterson & Neailey, 2002; Baker et al., 2014). This posture will be clear to lone wolves and burglars alike, leading to either an invitation or deterrence. As stated in the previous section, the register includes the value assigned to the risk, crime type, description of the crime, probability of occurrence of the action happening, severity if it did happen (high, medium, low), type of risk (people, property, reputation, etc.), mitigation decided upon, and if the mitigation control is effective or not.
A domain is weighted relative to the influence of other domains in the framework. A dominant outcome driver, or dominant domain, should not be ignored or treated as an equal. Domain weights can be assigned using a Likert scale, or be linked to variable significance. Domain-specific tasks and their weights inform the overall strategic plan. An understanding of the dynamic nature of internal and external metrics (Bandy, 2002), a prospect of future expectations (Chrusciel, 2011), and an awareness of the weighted performance drivers on the critical path are essential to the strategic plan.
The security team and leadership representation on the security team must decide what mitigation to deploy should be based on a cost-benefit analysis. They must also assure that the augmented control is in place. Additionally, they must have the means to know if the control has fallen out of place such that it is not mitigating the threat anymore. While the threat risk may be reduced, it may not disappear. When it is still present, it should stay on the register. It may be described differently, if needed. The frequency of occurrence of a loss should be reduced with the mitigation deployed.
Illusion of Security
Many leaders embrace an illusion of security. For example, a place of worship may have 140 surveillance cameras on its campus. These cameras may be offline, broken, dirty, not focused, with insufficient resolution, have a poor field of view, or be pointed in the wrong direction. However, when the leader is asked if they have adequate security management, their response is that there are 140 cameras covering the campus. While providing some deterrent value, having a large number of cameras does not provide the mitigating control to reduce threats since obfuscation techniques are well known. While insurance companies value camera systems, they typically do not check to see if they are working or even capable of forensic analysis. The intention of having these cameras is that they be used as a forensic tool to find out what happened after a crime is committed, assuming the needed footage is available. In the event that criminals do not remove the video storage device, other issues with the system may keep forensic footage from being available to law enforcement. Cameras may not handle light well, not have an appropriate field of view, go black in the dark, be out of service, flare when pointed towards sunlight, be obstructed, or be blinded by a nearby light source. The perception of security is not the same as good security.
Understanding threats is the start of a mitigating design. Having a system that is able to deescalate a threat scenario will reduce recovery losses as they may mitigate a bad act before it happens. Consequently, a threat-based approach is not only more effective, it is also cheaper. For example, purchasing surveillance equipment to cover areas where the threat is low or non-existent is a waste of resources, considering these resources should be collecting data where the risk is higher.
It is worth noting that often the assumption is that a building alarm system will take care of the security needs of the facility. Many thieves (specifically those who are repeat offenders) have adopted shared “best practices,” which have made them successful. With this knowledge, for example, a thief might know that it is possible to cut power in the power panel (or even at the meter), as well as cut the telephone or internet lines to the building, eliminating communication. It is also possible to disable alarm boxes. Even if communication is not cut, thieves typically know the response times to get in and out before the police arrive (“smash and dash”). While bad actors may only take items that will return $1000, they may cause $5000 worth of damage to achieve this. Damage to doors can be done to gain entry; however, “bumpkeys” can be used to gain access to almost any lock without damage. Burglars may also take DVR/NVR video storage with them, removing forensic evidence from the scene. When these scenarios are logged in the risk register, leaders become aware of vulnerabilities. Otherwise, they may believe that their existing security controls are keeping them secure, when in fact it is not the case.
Predictive Approach
This paper is not about the risk register, but rather the use of it to improve the security posture of a POW. An analysis produces no value until it is acted upon. Consequently, the scope of the discussion needs to include leadership’s status quo posture, and a posture that reduces the opportunity for risk-based losses and liabilities. The evolving discussion then includes the author’s position, that there are four types of leaders with regard to risk management.
The most vulnerable leader is the “head in the sand” leader. This leader does not think that anything could happen and if it does, then it was supposed to be that way. When an issue occurs, this POW will likely close down. The congregation will disburse, and the leaders will find new places to lead or become members of the flock. The damage is done, and the leader did not serve the interests of the parishioners. A defense that “it was supposed to be that way” may be an excuse for abdicating responsibility.
The second kind of leader is the reactive leader. The emphasis here is on recovery after a loss. A collection will be taken from the congregation to pay for the damage. An insurance claim is filed, and the rest of the cost–including the deductible–is taken from the reserve fund, if it exists. This money will be used to restore the property to the extent possible over a period of time.
The third type of leader is a proactive leader; this leader will take action to prevent risk loss from happening. Generally, this posture works except when a threat emerges that was not considered in the risk mitigation plan. In all of these cases, human loss is tragic. The proactive leader will try to minimize losses through preparedness and enhanced controls.
Finally, the predictive leader approaches the threatscape anticipating that changes in the threatscape will occur. As threats emerge or transpire elsewhere, this leader thinks about mitigations immediately. This leader thinks about threat possibilities and logs them. The predictive leader doesn’t need to recover because mitigations are anticipated and in place prior to the threat visiting the place of worship. The predictive leader will keep property, brand, and human loss from happening.
It is better to be predictive than reactive. This position is based on Nehemiah 4. While building the wall, Nehemiah understood the threats and took the right action in relation to predicted threats. He “posted a guard.” He implemented other controls to make sure the builders were ready for any threat. While all threats cannot be mitigated, stewardship demands an approach that prevents losses. Bad actors may have decided not to take malicious action because of Nehemiah’s preparations. Threats should be known and mitigated before they have the opportunity to cause damage.
Organizations should anticipate the discovery of threats and be able to assume a posture quickly to thwart the threat or discourage it. In some cases, controls may also help keep risk threats from escalating, as mitigating action can be executed before the severity of the threat increases. When leaders are ready to deter malicious acts, bad actors stand down.
Loss Likelihood and Impact
The ability to minimize loss by prioritizing preventive actions can be further understood through a risk threat matrix, as shown below. In this case, leadership can decide on the actions to take first by looking at the likelihood of a loss and the impact of it. When the existing controls are augmented and deployed, the RPN is reduced.
The risk threat matrix can be illustrated by taking each item from the risk register and giving it a location and relative area on a heat map. A heat map is a visual representation of data, using colors with associated values. The threatscape is essentially a heat map that shows which threats are critical and which ones are relatively insignificant. A severe impact along with an almost certain likelihood is the largest risk-loss threat. In this case, it is armed robbery. Robberies are common, and when armed, bad actors can injure or kill people who are in the church during the robbery. Other events are also severe, such as a terroristic shooting; however, this is not as common an occurrence as an armed robbery. The relative values of the threat type can be validated through a quantitative survey or through local crime statistics.
The area that represents each threat index relates to the speed of onset. The speed at which the threat is enacted is critical from a reaction time perspective. With a rapid speed of onset, the ability to mitigate the loss and deescalate the event after the act has been initiated is very low. Consequently, the losses will be higher when this threat is enacted as illustrated in the figure below. The values reflected by the risk loss matrix are set by the local security team and agreed upon by leadership.
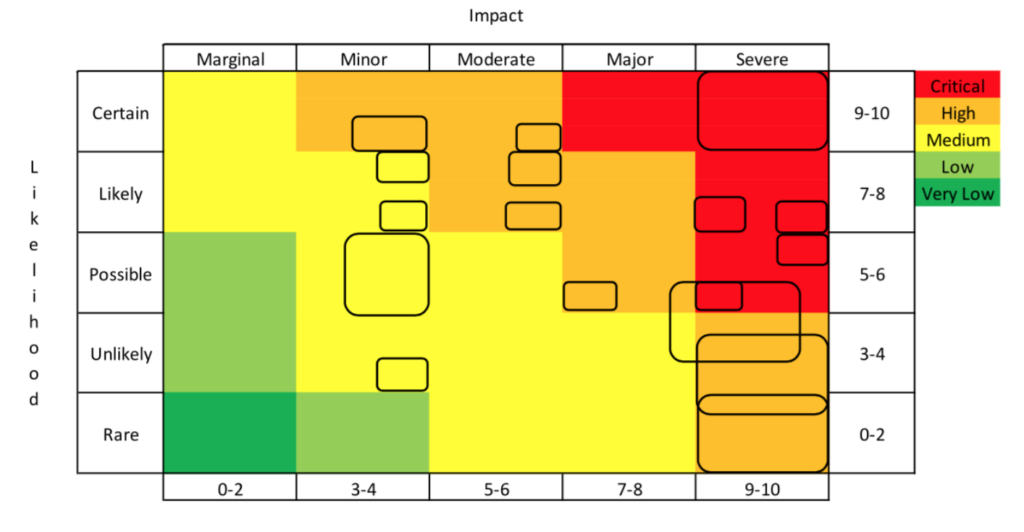
The risk loss matrix above is the current state prior to augmented controls. The impact of more powerful controls will reduce the speed of onset (the box size around the number), while shifting the location of the box in the heat map from critical to very low. In other words, the box around the number will shrink as the enhanced control increases the time of onset. The number and its shrinking box will move towards the left as the augmented control reduces the impact of an exploited vulnerability. Also, the number with its box will move downwards as the likelihood of the exploited vulnerability occurring is reduced. A reduction in the RPN ultimately indicates the management of the threatscape and a reduction in vulnerability at the POW. In sum, the movement of risk threats from the top right to the bottom left (the red zone to the green zone) makes them less likely, less impactful, and thus results in longer onset time. To accomplish this, leadership needs to be focused on the effective deployment of robust risk mitigations.
Having the right leadership for change activities is critical (Bossidy & Charan, 2002; Heifetz, 1994; Smith, Ferrier, & Grimm, 2001; Wilkinson, 2006). An effective leader needs to be an articulate and enthusiastic conceptualizer who is good at grasping strategies and explaining them (Bossidy & Charan, 2002). Leadership includes prioritization, deployment, and measurement against established goals. If outcome measurements indicate that effort has fallen short of a target, a leader may initiate a limited improvement cycle as remediation. Additionally, a framework review may be prudent due to project duration and environmental turbulence. A framework conceived during a time of stability may not be applicable during or following a time of volatility (D’aveni, Dagnino, & Smith, 2010). Once the framework design has been fine-tuned and verified as being appropriate by the POW security team, an accountable leader should initiate a repeat scan to refresh the gap analysis data. Continuous improvement is an aggressive leadership activity, allowing an organization that embraces learning to keep pace with a rapidly evolving environment (Ferrier, 2001; Mintzberg, Ahlstrand, & Lampel, 1998).
Conclusion
Clarity around strategic planning is needed for better organizational outcomes. Through collective sharing, predictive learning, and reflection, leaders can enhance their ES techniques by using meaningful tools. Quick wisdom generation is needed in a fast-paced environment; however, sometimes these efforts to collect information are hampered by constraints imposed by internal and external sources. For example, the availability of critical information may be a challenge for a decision-maker due to a lack of an organizational intelligence gathering capability or from an incomplete awareness of legal constraints. By increasing the “speed to wisdom,” strategic enactment, the potential is heightened and a more secure posture is achieved. Practically, an information collection capability coupled with an adaptive culture can be helpful in turning wisdom into action, as long as data is collected and recorded accurately, and can be extracted in a meaningful format (Choudhury & Sampler, 1997; Davis, 1985).
Strategic agility enables an organization to achieve desired outcomes (Sull, 2010) while sustaining organizational success (D’aveni, Dagnino, & Smith, 2010). Potentially strategic agility can be expressed in an algorithm as follows:
Strategic Agility = ES Accuracy x Agility x Adaptability
To elaborate, scanning accuracy is simply the capability to obtain and exploit knowledge of an organization’s situation in its environment, both current and future. Agility is the ability to minimize the negative influence of obstacles on momentum needed for adaptation. Adaptability is an organization’s ability to transform itself to stay ahead of threats, thereby preserving or increasing the organization’s viability and efficacy (Davis & Meyer, 1998).
In some cases, strategic planning is ad hoc with a dependency on serendipity that may or may not be forthcoming (Aguilar, 1967; Hambrick, 1979; Hambrick, 1981; Kefalas & Schoderbek, 1973). Alternatively, some organizations see value in planning and execution (Bossidy & Charan, 2002; Charan, Bossidy, & Burck, 2012). Organizations that plan may underestimate the complexity that exists between the environment and the aspect of the organization. Even a mature organization may not appropriately understand or leverage the links between domains that can improve outcome potential. For example, a control to mitigate vulnerability in one area may have a positive or negative impact in another. To understand this better, a confident organization, inviting of criticism, may allow their concerned parishioners, department leaders, and members of the security team to influence their framework design, its weighting, and the metrics that are being applied to have a better understanding of the complex and dynamic environment (De Pree, 2004).
Task selection within a threat domain directly impacts domain specific goal achievement (Bourgeois, 1980). These tasks are aligned with goals imposed on a situation. Ambiguity, uncertainty, and an understanding of residual risk in a system are critical aspects of environments in transition (Daft & Weick, 1984; Wilkinson, 2006). Specifically, perceived environmental uncertainty (PEU) is the difference between information needed to make a decision about a task and information available (Galbraith, 1973). PEU tends to mask composite measures sought after during scanning activities that drive task creation (Boyd & Faulk, 1996). Concurrently, leaders tend to act on a perceived environment (Boyd, Dess, & Rasheed, 1993) with a goal of achieving a desired adaptation to a more secure posture (Davis & Meyer, 1998; Hambrick, 1981). Task leaders must also know that environmental variation relates to changes that may occur independently of a leader’s ability to notice, comprehend, or interpret environment-related data (Doty, Bhattacharya, Wheatley, & Sutcliffe, 2006). Consequently, organizations tuned into their environment, while allowing for discovery, are more likely to succeed because they are able to respond predictively through meaningful action and contingencies to a wide range of signals (Slaughter, 1999). Leaders must understand that the security locus of control includes those who attend the POW and those who live or work nearby.
When direct (parishioners) and indirect (neighbors of the POW) stakeholders know that a strategic plan is thorough, and when they are given opportunities to influence the plan (Chrusciel, 2011), they are more inclined to be cooperative and in alignment with the objectives. Engaged stakeholders are also more likely to follow a meaningful path laid out for the organization, even if sacrifice is involved (De Pree, 2004). Even so, it is better to achieve a goal through strategy than through sacrifice. Although complexity is intensified with the diversity that exists within the stakeholder population, the methods discussed in this article aid in efficient and timely ongoing accomplishment of organizational postural transitions necessary in turbulent and evolving risk environments (Aguilar, 1967; Choo, 1999; El Sawy, 1985; Kefalas & Schoderbek, 1973; McEwen, 2008).
This article has attempted to provide theoretical models for the listing and assessment of threats, along with the power of the mitigating controls currently in place. The model also allows for improvement on the threatscape through quantitative control augmentation. While each situation is different, this article demonstrates that the opportunity to exploit vulnerabilities can be reduced significantly using the tools presented. Clearly, more research is needed to enable POWs and other similar organizations to rapidly evolve their threat governance capabilities so that risk-based loss is averted. As threats continue to evolve, rigidity of approach by leaders in places of worship puts lives and property at risk. Conversely, predictive leaders, through the use of suitable ES tools can reduce risk loss through posture adaptations.
References
Aguilar, F. J. (1967). Scanning the business environment. New York, NY: MacMillan.
Albright, K. S. (2004). Environmental scanning: Radar for success. Information Management Journal, 38(3), 38-44.
Anderson, P., & Tushman, M. (2001). Organizational environments and industry exit: The effects of uncertainty, munificence and complexity. Industrial and Corporate Change, 10(3), 675-711.
Bad Actor. (n.d.) In Merriam-Webster’s collegiate dictionary. Retrieved from https://www.merriam-webster.com/dictionary/bad%20actor
Baird, J. (2018). Churches can no longer hide domestic violence. The New York Times. Retrieved from https://www.nytimes.com/2018/05/10/opinion/churches-can-no-longer-hide-domestic-violence.html
Baker, R. H. A., Anderson, H., Bishop, S., MacLeod, A., Parkinson, N., & Tuffen, M. G. (2014). The UK plant health risk register: A tool for prioritizing actions. EPPO Bulletin, 44(2), 187-194.
Bandy, N. M. (2002). Setting service standards: A structured approach to delivering outstanding customer service for facility manager. Journal of Facilities Management, 1(4), 322-336.
Beal, R. M. (2000). Competing effectively: Environmental scanning, competitive strategy, and organizational performance in small manufacturing firms. Journal of Small Business Management, 38(1), 27-47.
Bixby, D., Kielmeyer, A., & Drake, D. (2010). United States National Church Shooting Database (1980-2005). ICPSR25561-v1. http://doi.org/10.3886/IcPSR25561.v1
Bossidy, L., & Charan, R. (2002). Execution, the discipline of getting things done. New York, NY: Crown Business.
Bourgeois, L. J. (1980). Strategy and environment: A conceptual integration. Academy of Management Review, 5(1), 25-39.
Bourgeois, L. J. (1985). Strategic goals, perceived uncertainty, and economic performance in volatile environments. Academy of Management Journal, 28(3), 548-573.
Boyd, B. K., Dess, G. G., & Rasheed, A. M. A. (1993). Divergence between perceptual and archival measures of the environment: Causes and consequences. Academy of Management Review, 18(2), 204-226.
Boyd, B. K., & Faulk, J. (1996). Executive scanning and perceived uncertainty: A multidimensional model. Journal of Management, 22(1), 1-21.
Brackertz, N., & Kenley, R. (2002). Evaluating community facilities in local government: Managing for service enablement. Journal of Facilities Management, 1(3), 283-299.
Branson-Potts, H. (2018). At a church security seminar: Guns, God, and “get those heads up” when you pray. Los Angeles Times. Retrieved from https://www.latimes.com/local/lanow/la-me-ln-church-security-20180522-story.html
Carpenter, M. A., & Frederickson, J. W. (2001). Top management teams, global strategic posture, and the moderating role of uncertainty. Academy of Management Journal, 44(3), 533-545.
Chadwick, C., Jr. (2018). First church crime study based on FBI data. The National Organization of Church Security & Safety Management. Retrieved from https://nocssm.org/blog/first-church-crime-study-based-on-fbi-crime-data/
Charan, R., Bossidy, L., & Burck, C. (2012). Execution: The discipline of getting things done. New York, NY: Random House.
Chinn, C. (2018). Deadly force incidents (DFI’s) at faith-based organizations in the U.S. Retrieved July 24, 2018, from http://www.carlchinn.com/deadly-force-statistics.html
Choo, C. W. (1999). The art of scanning the environment. Bulletin of the American Society for Information Science and Technology, 25(3), 21-24.
Chrusciel, D. (2011). Environmental scan: Influence on strategic direction. Journal of Facilities Management, 9(1), 7-15.
Cohen, W. M., & Levinthal, D. A. (1990). Absorptive capacity: A new perspective on learning and innovation. Administrative Science Quarterly, 35(1), 128-152.
Crockett, M. L. (2006). The federal role in the security of religious venues in America. Monterey, CA: Naval Postgraduate School.
Czarniawska, B. (2007). Complex organizations still complex. International Public Management Journal, 10(2), 137-151.
Daft, R. L., & Parks, D. (1988). Chief executive scanning, environmental characteristics, and company performance: An empirical study. Strategic Management Journal, 9(2), 123-139.
Daft, R. L., & Weick, K. E. (1984). Toward a model of organizations as interpretation systems. Academy of Management Review, 9(2), 284-295.
D’aveni, R. A., Dagnino, G. B., & Smith, K. G. (2010). The age of temporary advantage. Strategic Management Journal, 31(13), 1371-1385.
Davis, G. B. (1985). Management information systems: Conceptual foundations, structure, and development. New York, NY: McGraw-Hill.
Davis, S., & Meyer, C. (1998). Blur: The speed of change in a connected economy. New York, NY: Warner Books.
De Pree, M. (2004). Leadership is an art. New York, NY: Random House.
Dess, G. G., & Beard, D. W. (1984). Dimensions of organizational task environments. Administration Science Quarterly, 29(1), 52-73.
Diep, F. (2017). Church shootings are becoming much more common. Pacific Standard.Retrieved from: https://psmag.com/news/church-shootings-are-becoming-much-more-common.
Doty, D. H., Bhattacharya, M., Wheatley, K. K., & Sutcliffe, K. M. (2006). Divergence between informant and archival measures of the environment: Real differences, artifact, or perceptual error? Journal of Business Research, 59(2), 268-277.
Drake, D. (2018). Church shootings. Center for Homicide Research. Retrieved July 24, 2018, from http://homicidecenter.org/research/church-shootings/
Duncan, R. B. (1972). Characteristics of organizational environments and perceived environmental uncertainty. Administrative Science Quarterly, 17(3), 313-327.
Dutton, J. E., & Jackson, S. E. (1987). Categorizing strategic issues: Links to organizational action. Academy of Management Review, 12(1), 75-90.
Ebrahimi, B. P. (2000). Perceived strategic uncertainty and environmental scanning behavior of Hong Kong Chinese executives. Journal of Business Research, 49(1), 67-77.
Elenkov, D. S. (1997). Strategic uncertainty and environmental scanning: The case for institutional influences on scanning behavior. Strategic Management Journal, 18(4), 287-302.
El Sawy, O. A. (1985). Personal information systems in turbulent environments: Can the CEO go online? MIS Quarterly, 9(1), 53-60.
Fahey, L., & Narayanan, V. K. (1986). Macro environmental analysis for strategic management. St. Paul, MN: West Publishing.
Ferrier, W. J., Smith, K. G., & Grimm, C. M. (1999). The role of competitive action in market share erosion and industry dethronement: A study of industry leaders and challenges. Academy of Management Journal, 42(4), 372-388.
Galbraith, J. R. (1973). Designing complex organizations. Reading, MA: Addison-Wesley.
Goll, I., & Rasheed, A. M. A. (1997). Rational decision making and firm performance: The moderating role of environment. Strategic Management Journal, 18(7), 583-591.
Hambrick, D. C. (1979). Environmental scanning, organizational strategy, and executive roles: A study in three industries. Unpublished doctoral dissertation, Pennsylvania State University.
Hambrick, D. C. (1981). Specialization of environmental scanning activities among upper level executives. Journal of Management Studies, 18(3), 299-320.
Hambrick, D. C. (1982). Environmental scanning and organizational strategy. Strategic Management Journal, 3(2), 159-174.
Hesterman, J. (2014). Soft target hardening: Protecting people from attack. Boca Raton, FL: CRC Press.
Heifetz, R. A. (1994). Leadership without easy answers. Cambridge, MA: Harvard University Press.
Hough, J. R., & White, M. A. (2004). Scanning actions and environmental dynamism: Gathering information for strategic decision making. Management Decision, 42(6), 781-793.
Hrebiniak, L. G., & Joyce, W. F. (1985). Organizational adaptation: Strategic choice and environmental determinism. Administrative Science Quarterly, 30(3), 336-349.
Jennings, D., & Lumpkin, J. (1992). Insights between environmental scanning activities: An empirical analysis. Journal of Management, 18(4), 791-803.
Jogaratnam, G., & Wong, K. F. (2009). Environmental uncertainty and scanning behavior: An assessment of top-level hotel executives. International Journal of Hospitality and Tourism Administration, 10(1), 44-67.
Kefalas, A., & Schoderbek, P. P. (1973). Scanning the business environment: Some empirical results. Decision Sciences, 4(1), 63-67.
Lau, R. Y. K., Liao, S. S. Y., Wong, K. F., & Chiu, D. K. W. (2012). Web 2.0 Environmental scanning and adaptive decision support for business mergers and acquisitions. MIS Quarterly, 36(4), 1239-1268.
Lewis, C. (2017). Blood on the altar: The rise of sanctuary shootings. Ground Zero. Retrieved from https://www.groundzeromedia.org/116-blood-altar-rise-sanctuary-shootings/
Lindsay, W. M., & Rue, L. W. (1980). Impact of the organization environment on the long-range planning process: A contingency view. Academy of Management Journal, 23(3), 385-404.
MacLellan, L. (November 5, 2017). Church shootings are so common that there’s a database for them. Quartz. Retrieved from https://qz.com/1120799/texas-church-shootings-gun-violence-is-so-common-in-places-of-worship-that-theres-a-database-of-church-shootings/
McEwen, T. (2008). Environmental scanning and organizational learning in entrepreneurial ventures. The Entrepreneurial Executive, 13(1), 1-16.
Mejias, R. J. (2012). An integrative model of information security awareness for assessing information systems security risk. In System Science (HICSS), 2012 45th Hawaii International Conference (p. 3258-3267).
Milliken, F. J. (1987). Three types of perceived uncertainty about the environment: State, effect, and response uncertainty. Academy of Management Review, 12(1), 133-143.
Mintzberg, H., Ahlstrand, B., & Lampel, J. (1998). Strategy safari: A guided tour through the wilds of strategic management. New York, NY: Free Press.
Mitroff, I. I., & Emshoff, J. R. (1979). On strategic assumption-making: A dialectical approach to policy and planning. The Academy of Management Review, 4(1), 1-12.
Patterson, F. D., & Neailey, K. (2002). A risk register database system to aid the management of project risk. International Journal of Project Management, 20(5), 365-374.
Robinson, R. B. (1982). The importance of “outsiders” in small firm strategic planning. Academy of Management Journal, 25(1), 80-93.
Romain, A. (2017). This quote from a former FBI agent about the Texas church shooting shows just how unsafe our kids are. Romper. Retrieved from https://www.romper.com/p/this-quote-from-a-former-fbi-agent-about-the-texas-church-shooting-shows-just-how-unsafe-our-kids-are-3229797
Sawyerr, O. O. (1993). Environmental uncertainty and environmental scanning activities of Nigerian manufacturing executives: A comparative analysis. Strategic Management Journal, 14(4), 287-299.
Sawyerr, O. O., Ebrahimi, B. P., & Thibodeaux, M. S. (2000). Executive environment scanning, information utilization, and firm performance: The case for Nigeria. Journal of Applied Management Studies, 9(1), 95-115.
Schenck, R. (2017). Evangelical pastor: The church should help keep guns from abusers. Time.com. Retrieved from http://time.com/5013998/gun-violence-mass-shootings-domestic-abuse/
Shellnutt, K. (2017). A top reason for church shootings: Domestic abuse. Christianity Today. Retrieved from https://www.christianitytoday.com/news/2017/november/top-reason-church-shooting-domestic-violence-texas.html
Slaughter, R. A. (1999). A new framework for environmental scanning. Foresight: The Journal of Future Studies, Strategic Thinking and Policy, 1(5), 441-451.
Smith, K. G., Ferrier, W. J., & Grimm, C. M. (2001). King of the hill: Dethroning the industry leader. Academy of Management Executive, 15(2), 59-70.
Snow, C. C. (1976). The role of managerial perceptions in organizational adaptation: An exploratory study. The Academy of Management Proceedings. 1, 249-255.
Snyder, N. (1981). Environmental volatility, scanning intensity, and organizational performance. Journal of Contemporary Business, 10(2), 5-17.
Starbuck, W. H. (1976). Organizations and their environments. In M.D. Dunnette (Ed.), Handbook of Industrial and Organizational Psychology. Chicago, IL: Rand McNally.
Stewart, S. (2017). On security: Security at places of worship: More than a matter of faith. Retrieved from https://worldview.stratfor.com/article/security-places-worship-more-matter-faith
Sull, D. (2010). Competing through organizational agility. The McKinsey Quarterly, 1, 48-57.
Sutcliffe, K. M. (1994). What executives notice: Accurate perceptions in top management teams. Academy of Management Journal, 37(5), 1360-1378.
Thompson, J. D. (1967). Organizations in action. New York, NY: McGraw-Hill.
Tsai, W. M. H., MacMillan, I. C., & Low, M. B. (1991). Effects of strategy and environment on corporate venture success in industrial markets. Journal of Business Venturing, 6(1), 9-18.
United States National Church Shooting Database (1980-2005), Princeton University Library, Data and Statistical Services. Retrieved from http://dx.doi.org/10.3886/IcPSR25561.
Valencia, M. (2010). When the gods strike back. Interviewed by The Economist. Retrieved from www.economist.com/node/15474137
Venkatraman, N. (1989). The concept of fit in strategy research: Toward verbal and statistical correspondence. Academy of Management Review, 14(3), 423-444.
Warf, B., & Winsberg, M. (2010). Geographies of megachurches in the United States. Journal of Cultural Geography, 27(1), 33-51.
Wilkinson, D. J. (2006). The ambiguity advantage: What great leaders are great at. London, UK: Palgrave Macmillan.
Yasai-Ardekani, M, & Nystrom, P. C. (1996). Design for environmental scanning systems: Tests of a contingency theory. Management Science, 42(2), 187-204.
Zahra, S. A. (1987). Corporate strategic type, environmental perceptions, managerial philosophies, and goals: An empirical study. Akron Business and Economic Review, 18(2), 63-74.
Joel D. Bigley, Ed.D. is an assistant professor and business administrator at the Dr. Robert K. Jabs School of Business at California Baptist University in Riverside, California.